TrueCommand Nightly Development Documentation
This content follows experimental early release software. Use the Product and Version selectors above to view content specific to a stable software release.
Dashboard
3 minute read.
Last Modified 2024-03-15 13:07 EDTThe TrueCommand Dashboard provides an overview of each connected TrueNAS system in system widgets (information cards).

The top banner includes two sort options, one to filter the view to show All or Ungrouped systems and the other to sort either by Name or Order. The default view shows all widgets for all NAS systems added to and managed by TrueCommand. Use the Find field to search for a system by name. To add a new system, click New System.
For more information on the top toolbar icons, refer to the Interface Overview article in the Getting Started Guide.
Each system has a unique widget (information card) that displays usage metrics including CPU, Temp and Storage, the number of pools and drives in the system, network, I/O read/writes and the disk verses cache usage.
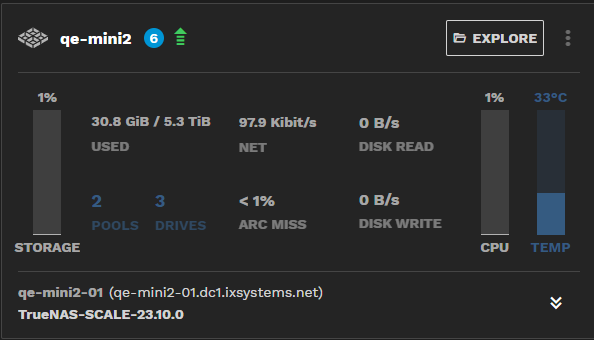
The Storage graph shows how many pools and drives the system has and the storage consumed and available by size and percentage.
ARC MISS shows how often the system uses disks instead of the ARC cache. Anything above 0% means that the system is using RAM. The numbers vary by use case and workload.
Click the double down arrow to show more information on system hardware, serial number, hostname, CPU and memory, and uptime.
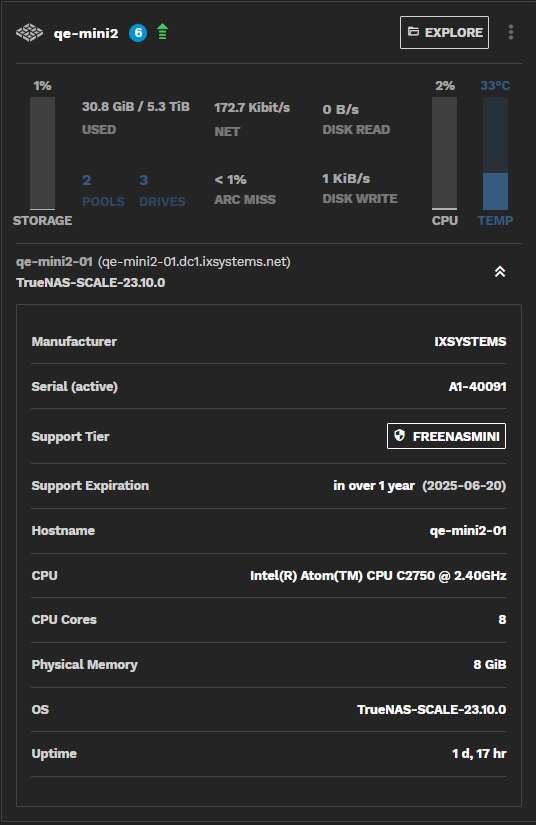
An alert bubble appears next to the system name and indicates the number of alerts detected for the system. For details on system alerts click the gear settings icon, then All Alerts to open the Alerts screen. See Alert Management for further information.
Click on the system name to open an expanded view of the system with more single system management options.
Click on DRIVES, DISK WRITE, DISK READ to open the disk activity graph for each to view the system statistical history.
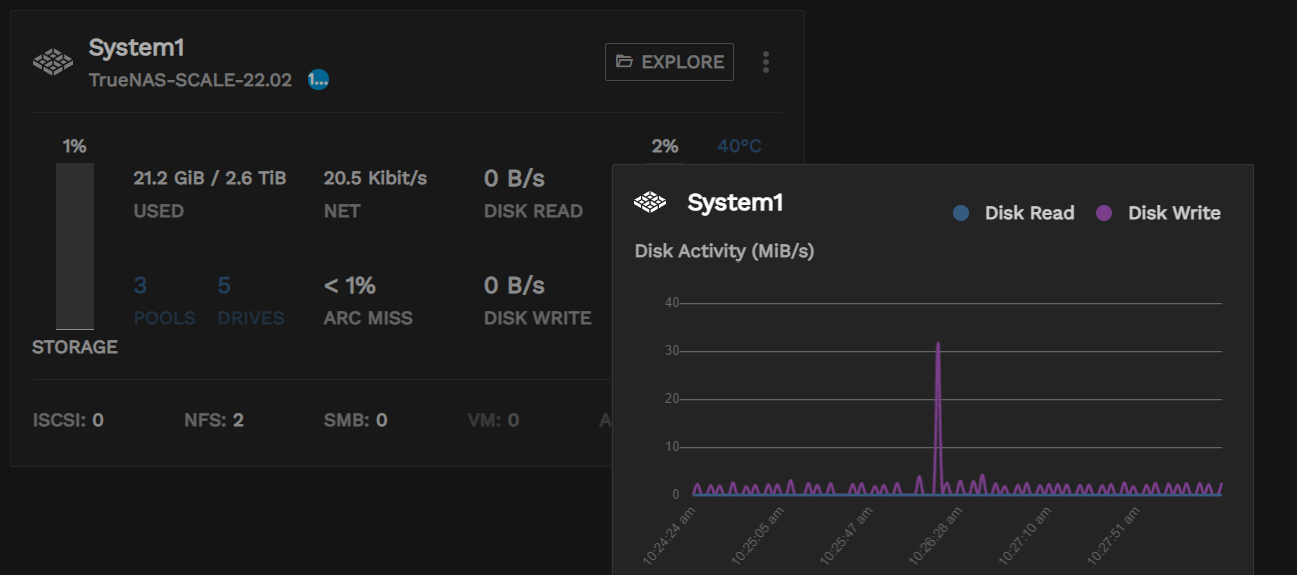
Click on NET opens a Net Used graph.

Click on CPU to open the CPU Usage percentages graph.
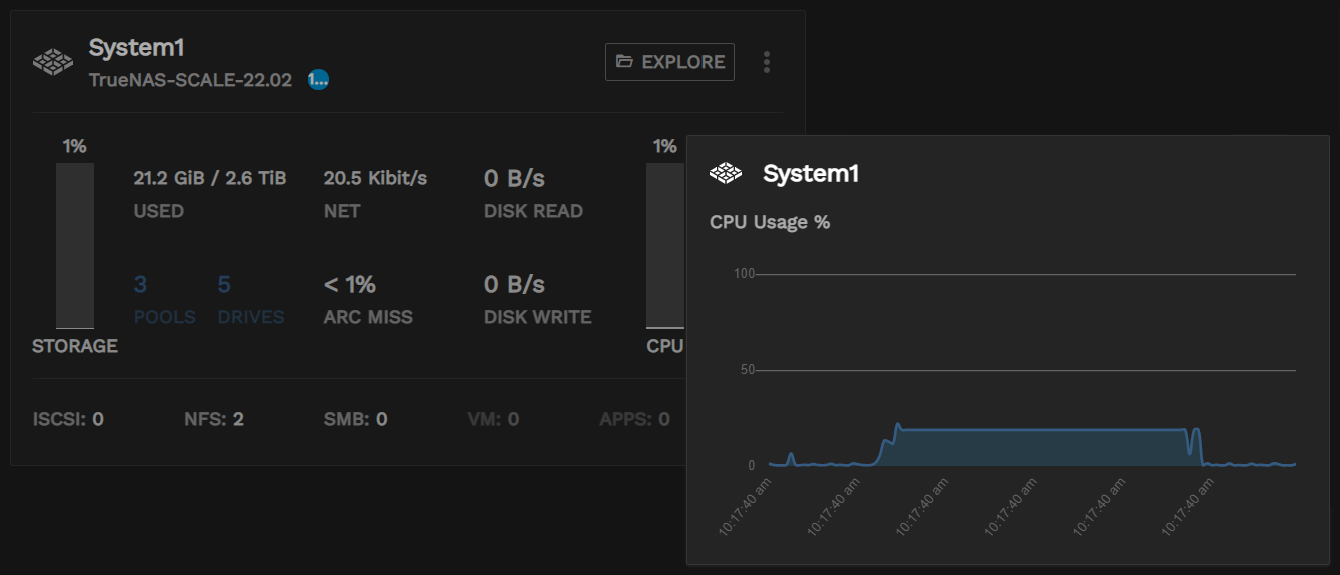
Click on TEMP to open the CPU temperature percentages graph.
Available to administrator users. Non-administrator users have access to some of the options, but only for systems they have permission to access.
The stacked dot icon opens the system options menu.
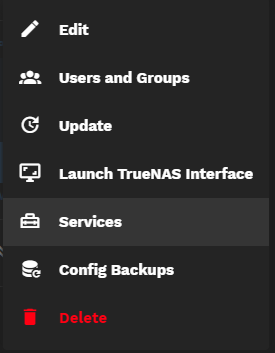
The system options menu links to other tasks.
- Edit opens the Edit system window for the TrueNAS connection. Only available for administrator users.
- Users and Groups opens the TrueNAS Users screen where you can add or manage TrueNAS users and groups.
- Update opens the Update NAS window if updates are available for the TrueNAS system.
- Launch TrueNAS Interface opens a new tab with the sign in screen for the TrueNAS Web UI (SCALE or CORE).
- Services opens the Services screen listing the services for the TrueNAS system.
- Config Backups that opens the Config Backups screen.
- Delete opens the Delete system dialog used to remove the TrueNAS system from TrueCommand.
The Expore button on individual system widgets opens the File Explorer that provides access to dataset, zvol, share, snapshot, and replication information for that TrueNAS system.

