TrueCommand Documentation Archive
This content follows TrueCommand 2.3 releases. Archival documentation is provided for reference only and not actively maintained.
Use the Product and Version selectors above to view content specific to different TrueNAS software or major versions.
System Management
3 minute read.
Last Modified 2023-09-21 09:21 EDTThe TrueCommand dashboard provides status overviews of each connected TrueNAS system.

For information on the Top Bar and its options, refer to the Interface Overview article in the Getting Started Documentation.
Each system has a unique card to display statistics. When the system has an alert, an Alerts bubble appears next to the system version to show how many alerts there are for that specific system. See Alert Management for further information.

The Storage graph shows how many pools and drives the system is using. It also displays used and available storage by size and percentage.
ARC MISS shows how often the system is using disks instead of the ARC cache. Anything above 0% means that the system is using RAM. The numbers vary by use case and workload.
There are also several “hot spots” on the card that open system-specific areas for management.
Clicking the system name on the card shows an expanded view of the system with more Single System Management options.
Clicking the Alerts bubble next to the system version opens an expanded system information screen that lists the current system alerts.
Clicking DRIVES, DISK WRITE, DISK READ displays the disk activity graph.
Clicking NET displays the Net Activity graph.
Clicking CPU displays the CPU Usage percentages graph.
Clicking TEMP displays the CPU Temperature percentages graph.
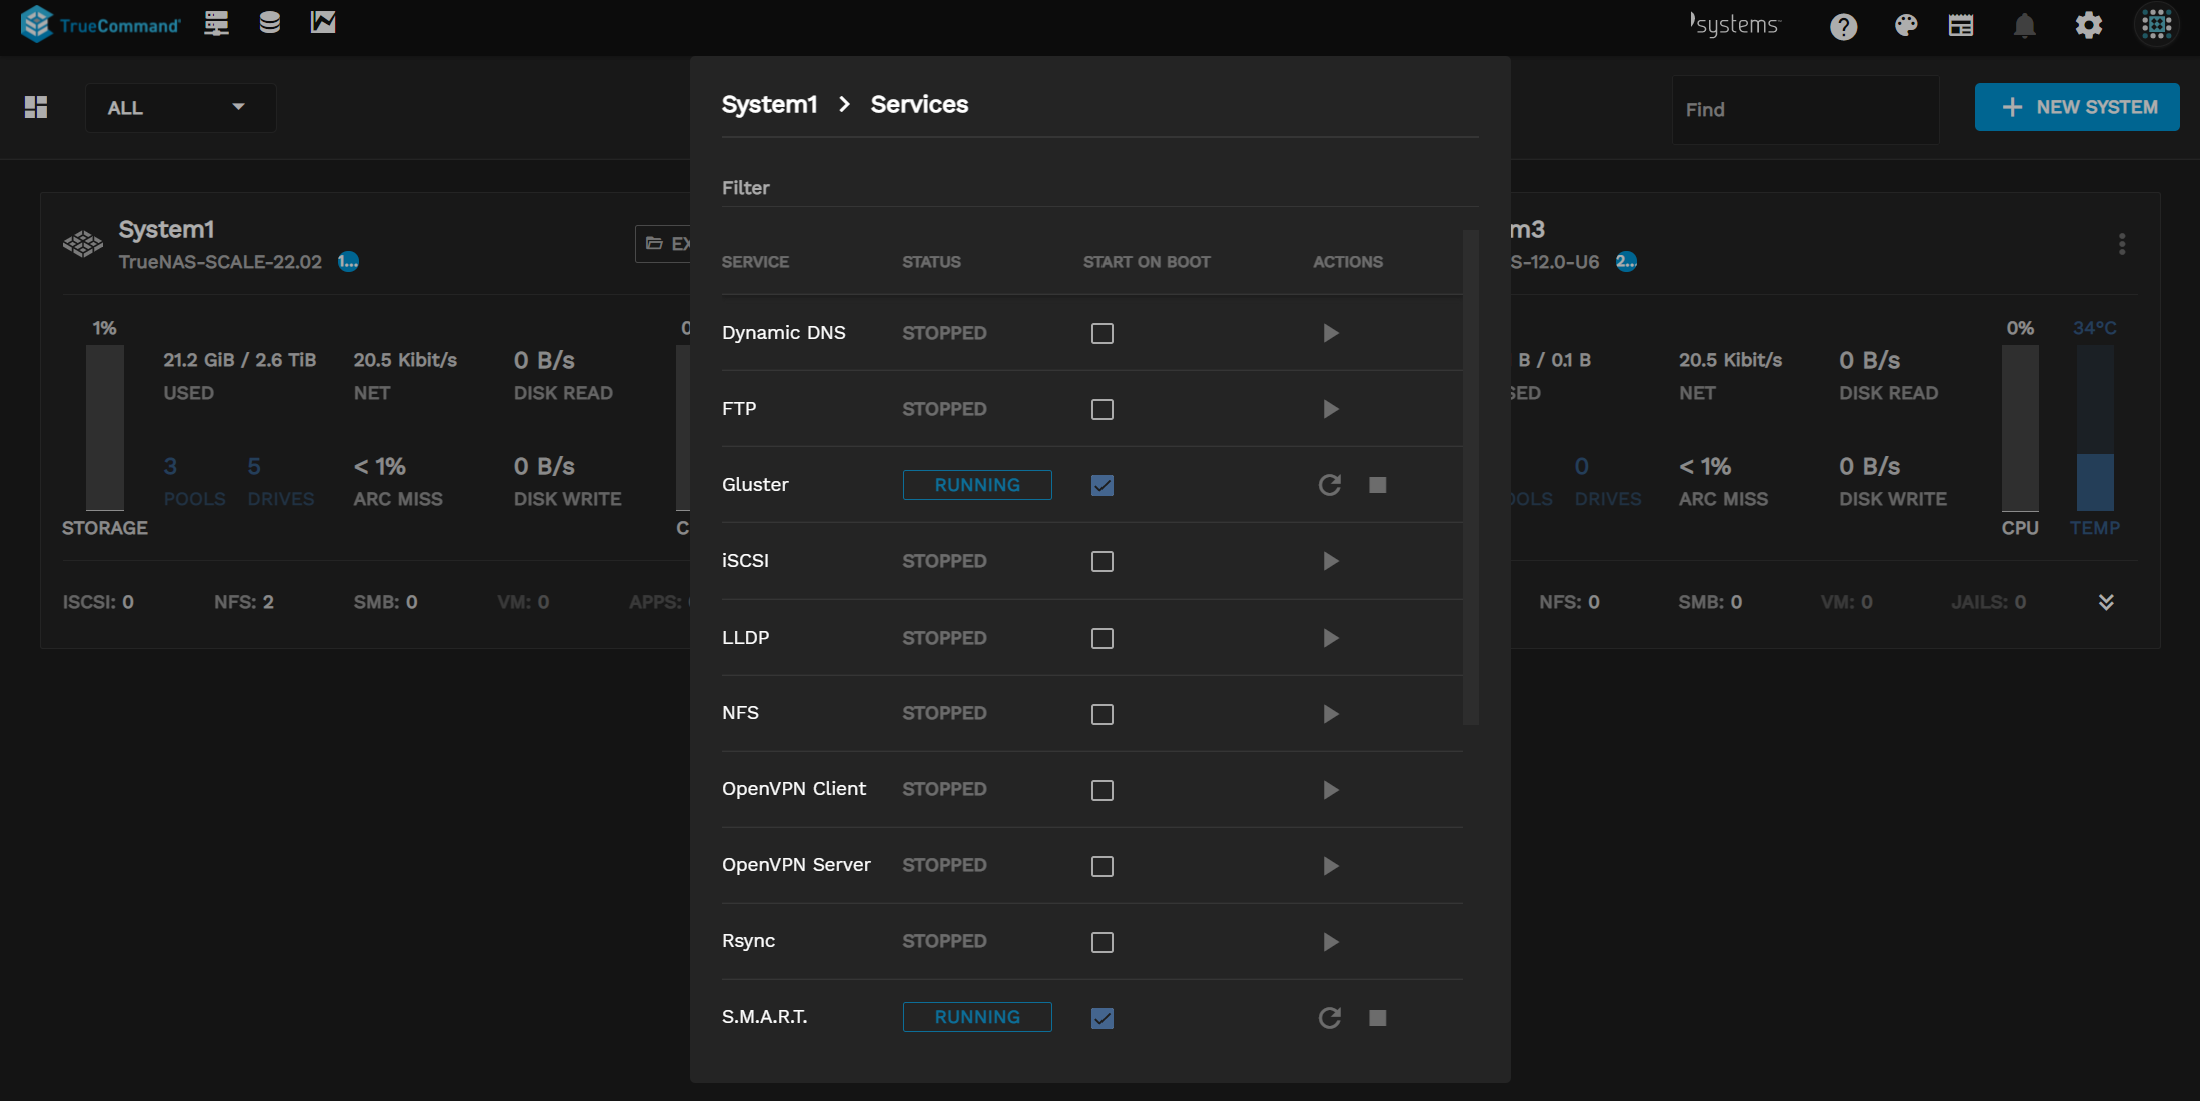
Clicking ISCSI, NFS, and SMB opens a Services window that allows users to stop/start services for the system.
Clicking VM opens a Virtual Machines window that allows users to start/stop VMs on the system.
Clicking APPS (SCALE) or Jails (CORE 12.x) allows users to start/stop apps/jails on the system.

The Options menu has several shortcuts to simple tasks.
- Edit opens the edit window for the TrueNAS connection details and nickname.
- Users and Groups lets users manage NAS users and groups.
- Update updates the TrueNAS system.
- Launch TrueNAS Interface opens a new tab for the full TrueNAS Web UI.
- iSCSI Volumes opens that specific TrueNAS system iSCSI management page.
- Services lets users see service statuses and control service actions.
- Delete removes the system from TrueCommand. Deleting does not affect any data stored on the TrueNAS system. However, it does delete all system metrics saved in TrueCommand.

Click on the CPU, Disk, and Network values displays the system statistical history.
- CPU

- Disk

- Network

TrueCommand’s activity icons provide an at-a-glance indication of what the system is doing. The indicators appear next to the system nickname.

- Update:

- Replication:

- Resilver/Scrub :

- Single System Management: How to use TrueCommand to manage a single connected TrueNAS system.
- System Settings: How to edit individual TrueNAS system settings in TrueCommand.
- Config Backups: How to back up a connected TrueNAS system configuration.
- TrueCommand Storage Management: How to manage TrueNAS storage within TrueCommand.
- TrueCommand Snapshots: Provides instructions on setting up and running TrueNAS storage snapshots in TrueCommand.
- TrueCommand Sharing: How to view and manage data sharing for a connected TrueNAS system.
- iSCSI Volume Management: Provide information on managing iSCSI block shares and iSCSI volumes in TrueCommand.
- TrueNAS Configuration File Management: How to find and use TrueNAS system configuration files within TrueCommand.
- Multiple Systems: How to find and use TrueNAS fleet management features in TrueCommand.
- NAS Users and Groups: How to bulk create user and group accounts across many connected TrueNAS systems.

