Reporting
6 minute read.
The Reporting screen displays graphs of system information for CPU, disk, memory, network, system functions, UPS, and ZFS. Use the dropdown in the upper right corner to select between reporting graph display options. The CPU report displays by default.
TrueNAS uses Netdata to gather metrics, create visualizations, and provide reporting statistics.
The built-in Netdata UI, accessible from the Netdata button on the Reporting screen in TrueNAS 24.04 and 24.10, is removed in TrueNAS 25.04 (and later) for security hardening. Users wishing to continue using the Netdata UI to monitor system reports can install the Netdata application.
To configure a third-party reporting integration, such as Graphite, click Exporters to open the Reporting Exporters screen.
The following sections provide examples of each report graph. There are a few controls to change the default graph view:
The Auto Refresh toggle updates the graphs with the latest reporting data every few seconds. When active, the graph resets to the chosen Reset Zoom view every time the reporting data updates. Disable Auto Refresh before manually zooming in on any section of the graph.
Step Back () moves the graph backward in time by whatever time increment is currently active in Reset Zoom.
Step Forward () moves the graph forward in time by whatever time increment is currently active in Reset Zoom. The default graph view is to show the latest data, which disables this button.
Zoom Out () adjusts the time period shown in the graph between 1 Hour, 1 Day, 1 Week, 1 Month, and 6 Month views.
The Reset Zoom indicator shows which time value is active for the graph. The default 1 Hour is the default (and minimum) time period that can be active. When Zoom Out is active, click Reset Zoom to reset the graph view to 1 Hour.
Zoom In () adjusts the time period shown in the graph between 1 Hour, 1 Day, 1 Week, 1 Month, and 6 Month views. This is active when the graph changes from the default 1 Hour view.
To manually adjust the vertical or horizontal precision of the graph, disable Auto Refresh, then click and drag within the graph view. A left-to-right (or vice-versa) motion increases the horizontal view precision, while an up-to-down (or vice-versa) motion increases the vertical precision.
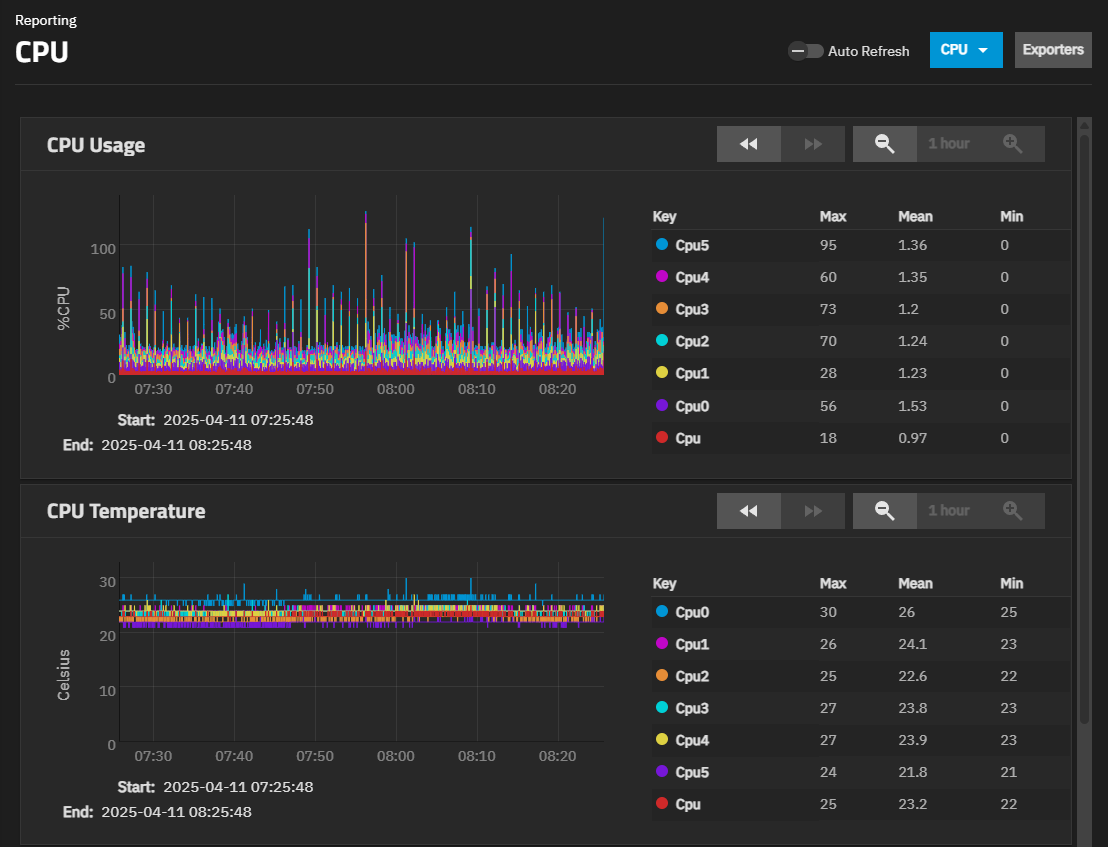
Shows the CPU temperature, CPU usage, and system load graphs. CPU graphs show the amount of time the CPU spends in various states such as executing user code, executing system code, and idle time. Graphs show short-, mid-, and long-term loads, along with CPU temperature graphs.
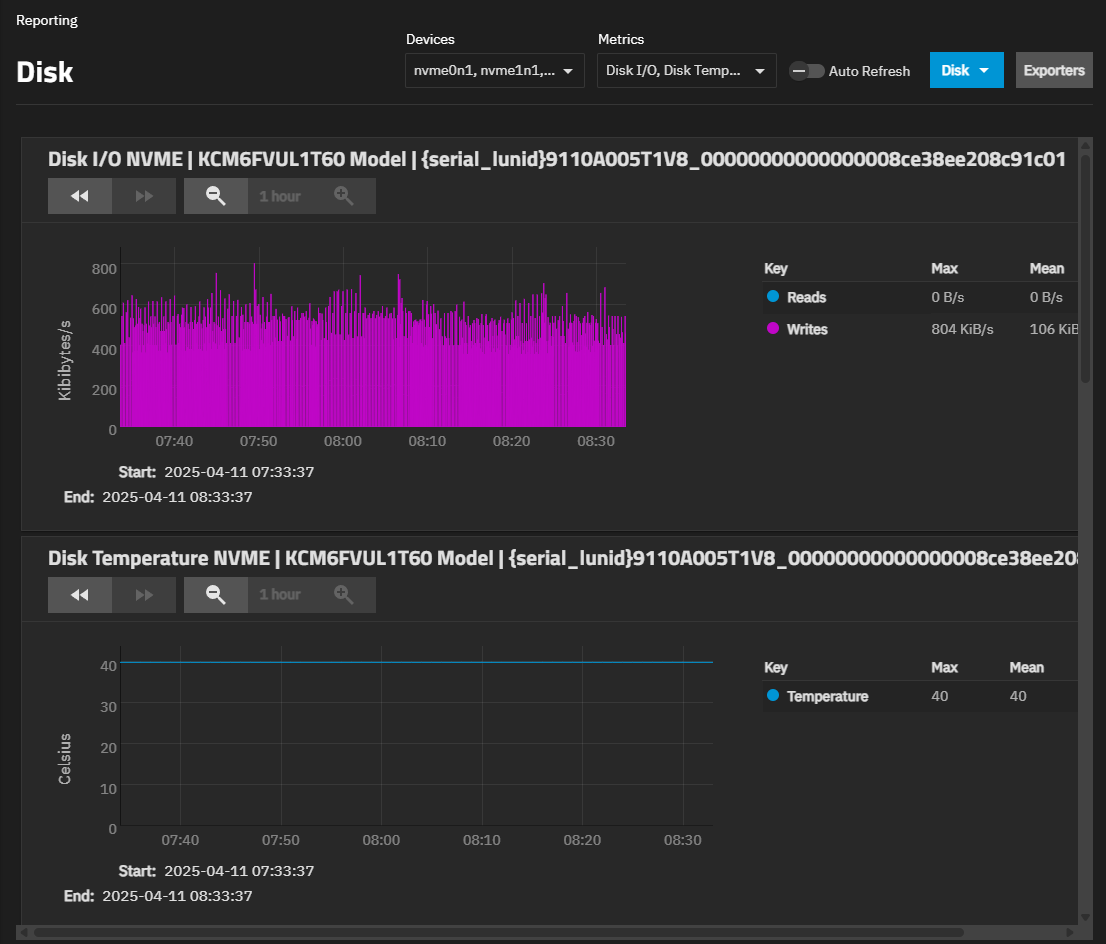
Shows graphs for each selected system disk, and by report type. Disk graphs show read and write statistics on I/O, percent busy, latency, operations per second, pending I/O requests, and disk temperature.
Use the Select Disks dropdown to select the disks. Use the Select Reports dropdown to select the report types to display.
Shows the Physical memory available graph with the amount of free memory available based on current memory usage.
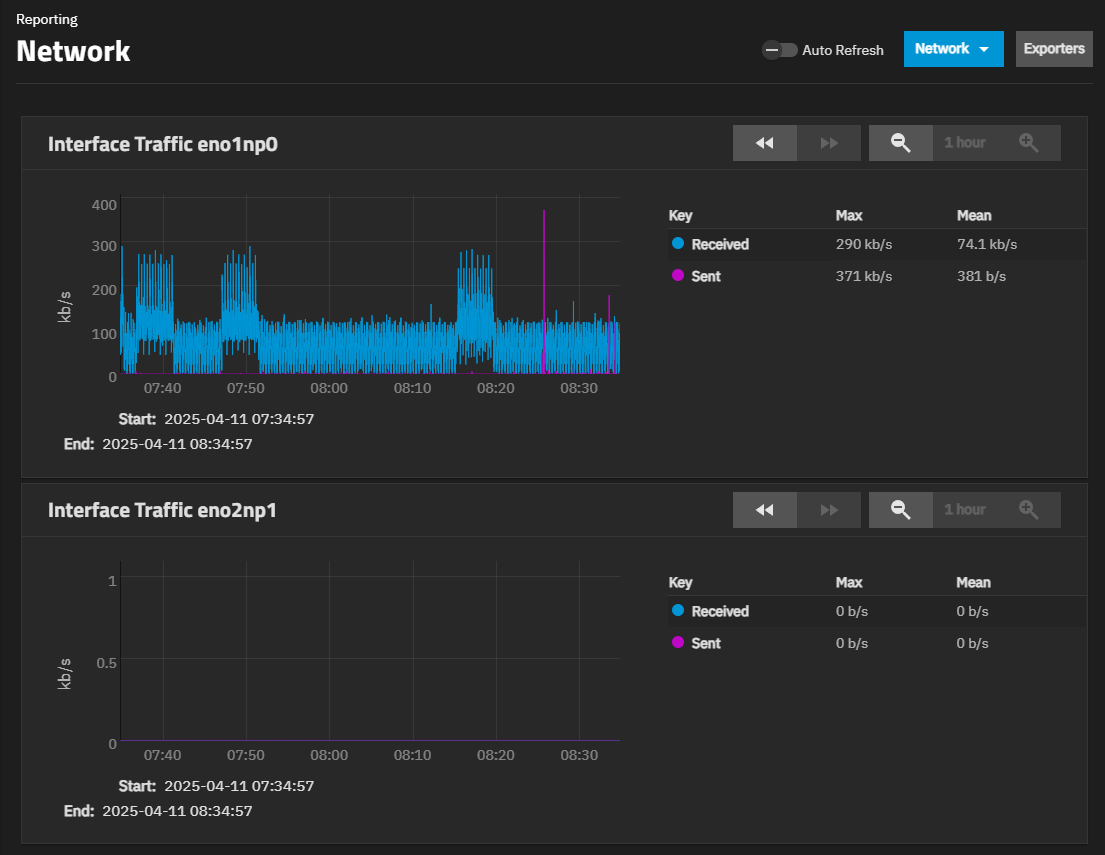
Shows an Interface Traffic graph for each interface in the system. Network graphs report received and transmitted traffic in megabytes per second for each configured interface.
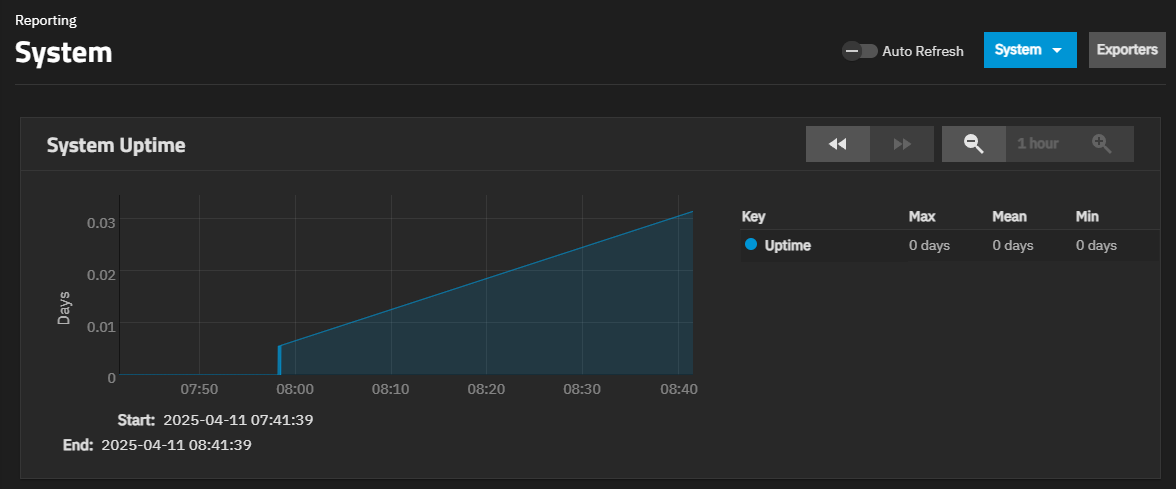
Shows the System Uptime graph.
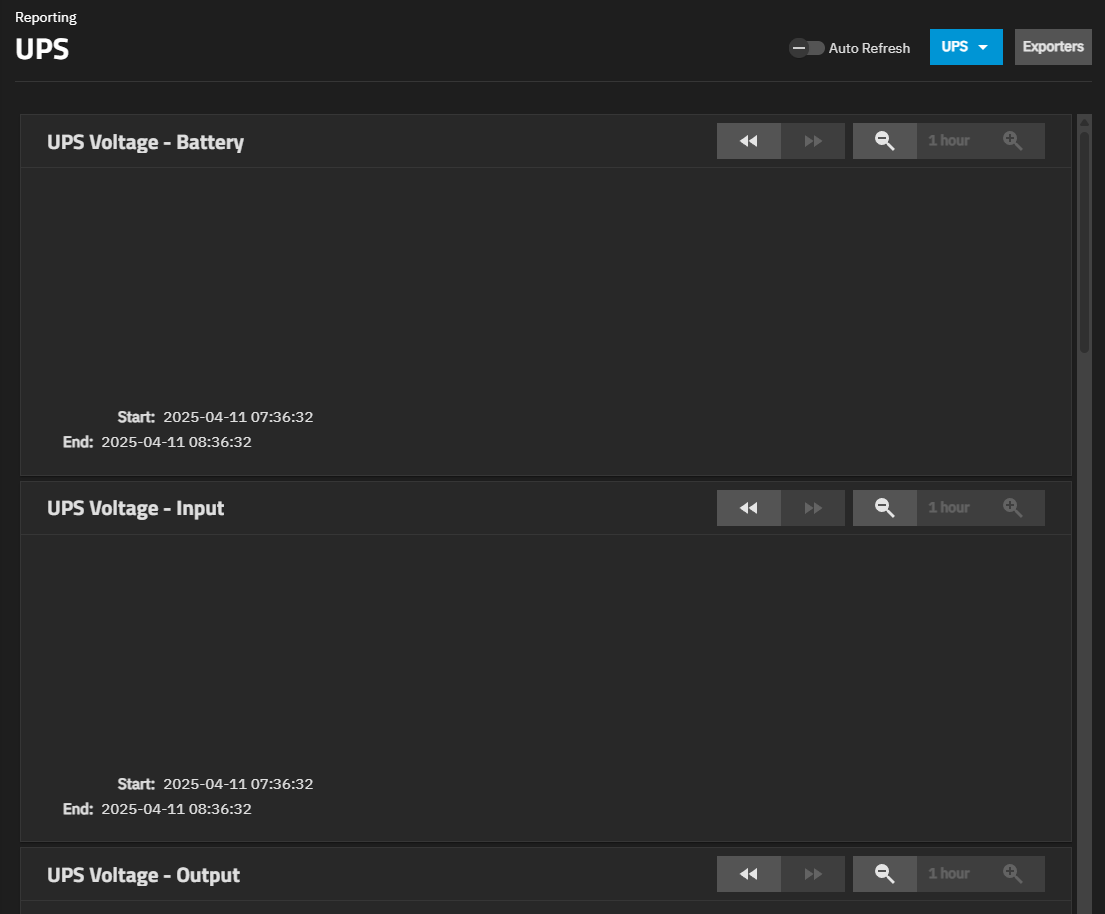
Shows the UPS UPS voltage for battery, input, and output, charging percentage, UPS runtime, UPS input current, frequency, and input load, and UPS temperature.
The UPS service must be configured with a compatible Uninterruptible Power Supply (UPS) device.
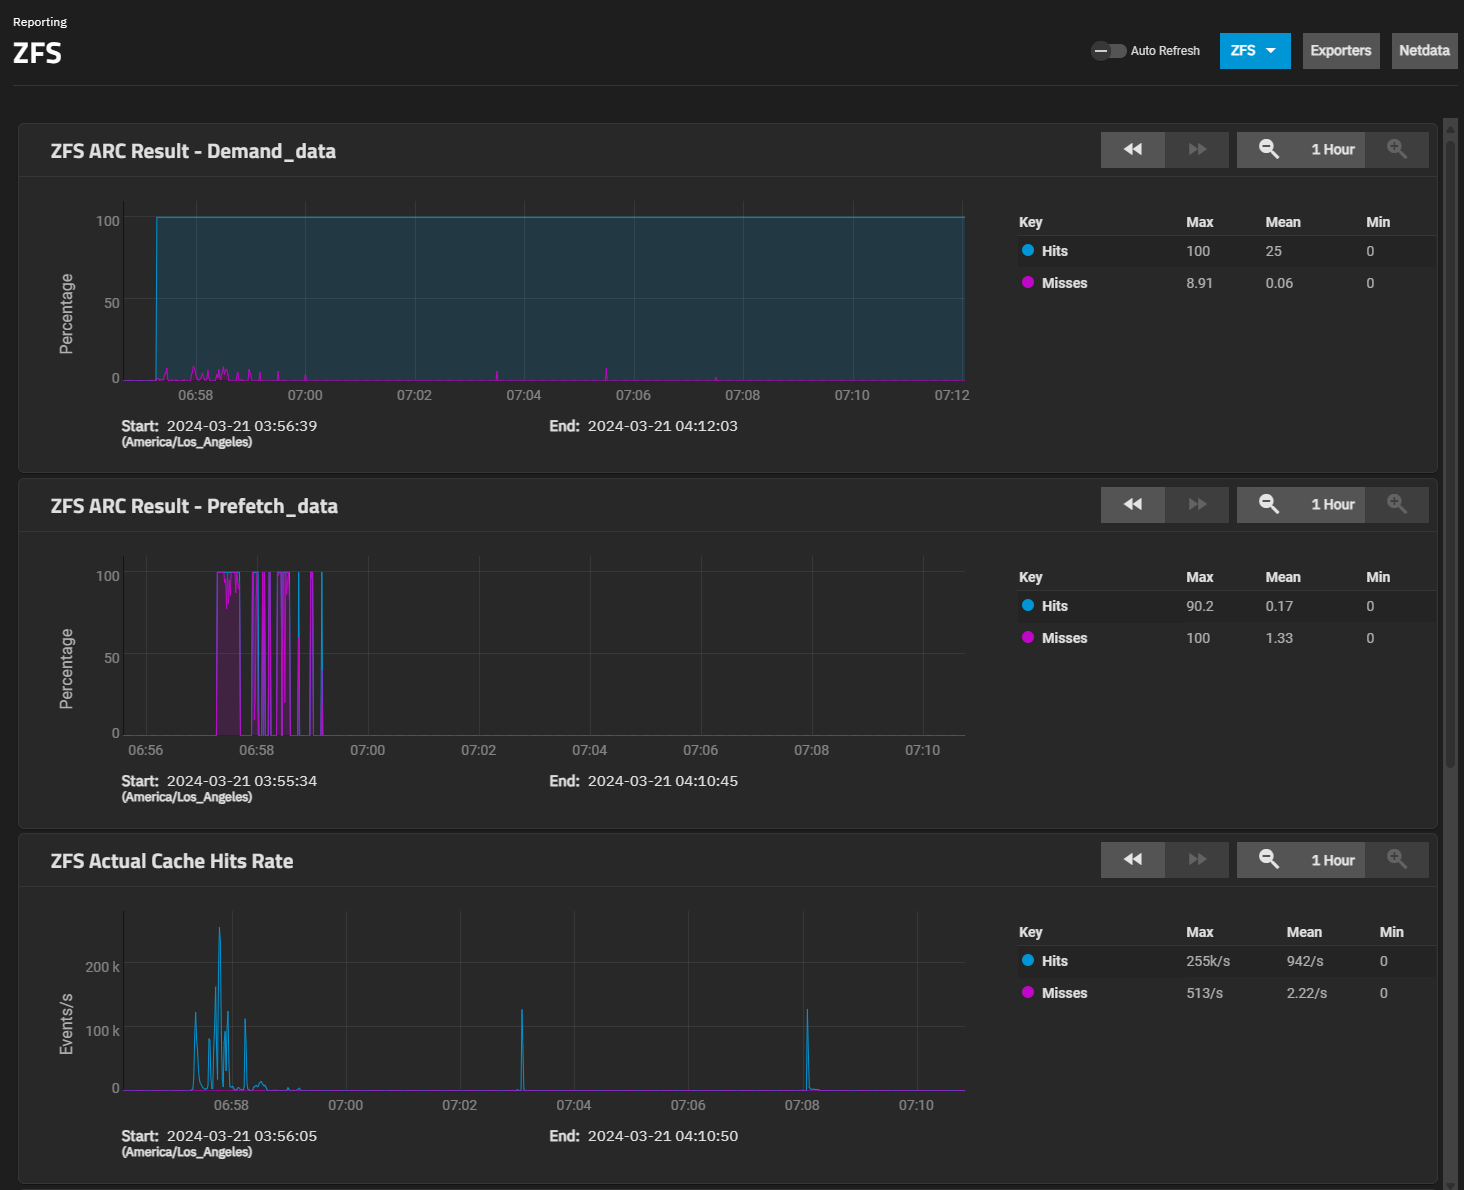
Shows the ZFS ARC size graph with compressed physical ARC size.
Exporter on the Reporting screen opens the Reporting Exporter screen. The Reporting Exporters screen shows reporting exporters configured on the system.
Exporting enables TrueNAS to send reporting metrics to another time-series database. Exporters send reporting records as JSON objects to third-party reporting collection cloud services or applications installed on servers.
Add opens the Add Reporting Exporter screen.
Use the Add Reporting Exporter screen to configure third-party reporting integrations.
| Setting | Description |
|---|---|
| Name | Enter a unique name for the exporter configuration. If configuring multiple instances, give each a distinct name. |
| Type | Select the report object format. At present, GRAPHITE is the only current supported option. Selecting GRAPHITE displays the exporter configuration settings |
| Enable | Select to enable sending reporting data to the configured exporter. Leave the checkbox clear to disable the explorer without removing the configuration. |
Additional settings populate based on the selected Type option.
| Setting | Description |
|---|---|
| Destination Ip | (Required) Enter the IP address of the Graphite server. |
| Destination Port | (Required) Enter the port the Graphite server monitors. |
| Prefix | Enter the top level of the file hierarchy for the path to use to store exported records. For example, enter the top-level folder name for the path, and use Namespace to enter the folder for the data records. For example, enter dragonfish. |
| namespace | Enter the name of the folder where you store data records. Use the Prefix to define the full path. You can also enter the host name to add to all data records sent to the Graphite server. Defaults to truenas. |
| Update Every | (Optional) Enter the number of seconds for the interval to send data to the Graphite database. Defaults to 1. |
| Buffer On Failures | (Optional) Enter the number of iterations (Update Every seconds) to buffer data when the Graphite server is not available. Defaults to 10. |
| Send Names Instead Of Ids | (Optional) Enter true to send Netdata chart and dimension names to Graphite or false to send IDs. Defaults to true. |
| Matching Charts | (Optional) Enter one or more space-separated patterns in regular expression. Use the asterisk () as a wildcard to send all charts or the exclamation mark (!) to define a negative match to specify the charts to send to Graphite. Defaults to (). |
See Adding a Reporting Exporter for guidance with configuring a Graphite exporter on TrueNAS.


