Audit Logs
12 minute read.
TrueNAS auditing and logs provide a trail of all actions performed by a session, user, or service (SMB, middleware).
The audit function backends are the syslog and Samba debug libraries. Syslog sends audit messages via an explicit syslog call with configurable priority (WARNING is the default) and facility (for example, USER). The default is syslog-sent audit messages. Debug sends audit messages from the Samba debug library. Messages have a configurable severity (WARNING, NOTICE, or INFO).
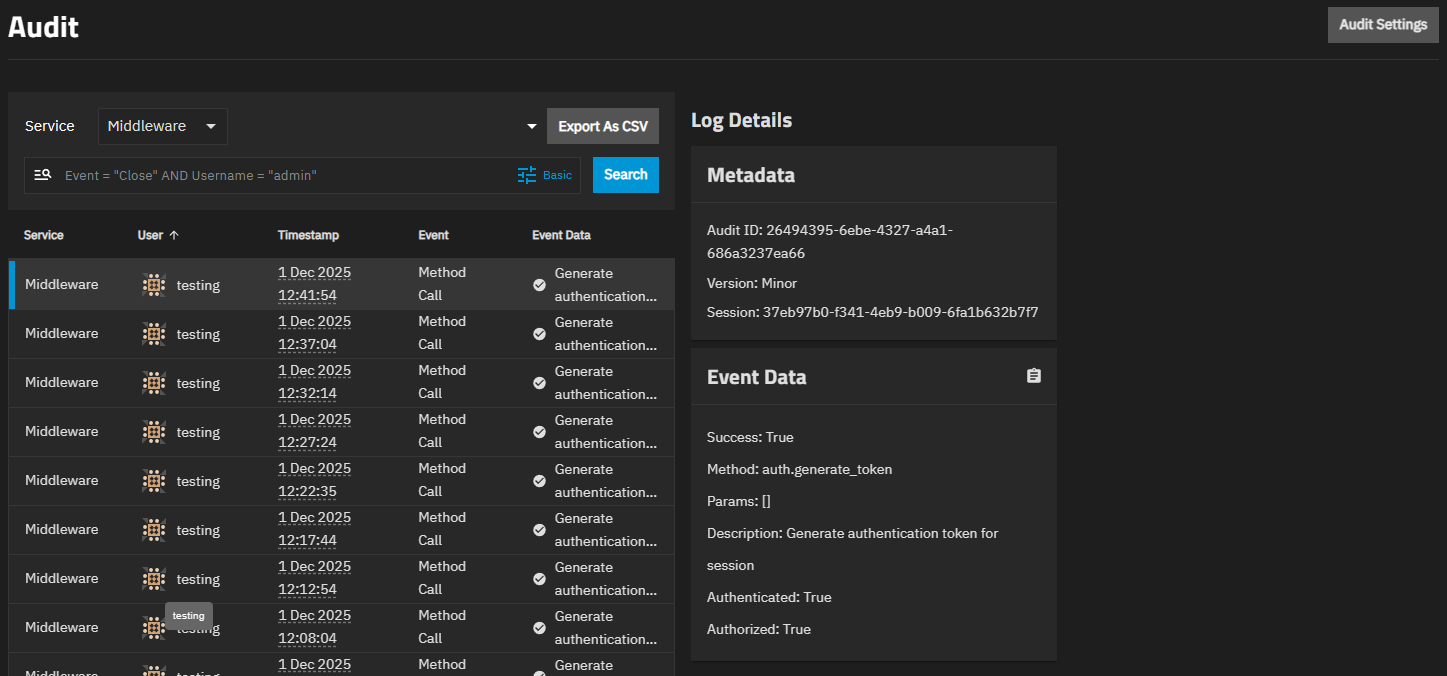
The System > Audit screen lists all session or user events, facilitating comprehensive monitoring. Logs include who performed the action, timestamp, event type, and a short string of the action performed (event data).
TrueNAS includes a manual page with more information on the VFS auditing functions.
Audit logs retain at least one week of data. Logs are downloadable.
Auditing event types are:
- Session and user
- Sudo and root user commands (includes STIG-compliant shell commands)
- SMB protocol and share
- iSCSI protocol and share
- FTP service
- STIG-compliant security objects
- HA shutdown and restart reason
Enterprise and Enterprise HA systems have security object (FIPS and STIG) event logging. HA primary and standby controller event logs are downloadable from either the primary or the standby controller.
Session and user auditing events include authentication, method call, and sudo accept/reject events.
SMB events are omitted by default from the System > Audit screen. To view these audit results, go to System > Services and click receipt_long Audit Logs for the SMB service or use the Service dropdown on the main Audit screen to select SMB.
SMB audit logs include all SMB protocol events, but do not include changes to SMB configuration, such as creating an SMB share or querying and modifying SMB ACLs. See the middleware service log to review those events.
SMB authentication events are logged globally for all users connecting to the SMB server, regardless of Watch List or Ignore List configuration. Watch and ignore lists control subsequent SMB operations (connect, create, write, read, etc.) but do not filter authentication events. This ensures a complete audit trail of all authentication attempts for security and compliance purposes.
Audit records contain information that establishes:
- Type of event
- When the event occurred (timestamp)
- Where the event occurred (source and destination addresses)
- Source of the event (user or process)
- Outcome of the event (success or failure)
- Identity of any individual or file names associated with the event
Each audit message is a single JSON file containing mandatory fields. It can also include additional optional records. Message size is limited to not exceeding 1024 bytes for maximum portability with different syslog implementations.
Use the Export button on an audit screen to download audit logs in CSV, JSON, or YAML format. CSV format is readable in spreadsheet programs. Use the Copy to Clipboard option on the Event Data widget to copy the selected audit message event record to a text or JSON object file. The JSON object for an audit message contains the version information, the service that might be the name of the SMB share, a session ID, and the tree connection (tcon_id).
Users have access to audit information from three locations in the TrueNAS UI:
- Credentials > Users details screen through the Audit Logs option * On the Users screen, click Audit Logs on the Users details screen to open the Audit log screen with the Search field filtered to show events (authentication, changes to existing users, creating new users, etc.) specific to that user. For more details, see Audit Screen.
- Shares > Window (SMB) Shares details screen through the share edit Audit Logging option * On the Sharing screen, click the Edit icon on the desired SMB share row where Enable, watch and ignore settings are available. For details, see Configuring SMB Auditing.
- System > Services > SMB to view SMB audit logs * On the Services screen, click the Audit Logs icon on the SMB row. This opens the main Audit log page with the Search field filter configured to show only SMB events. For details, see Audit Screen.
- System > Audit option on the main navigation panel * The default Audit log screen is unfiltered and displays all system events such as authentication and SMB events.
Use the Service dropdown at the top of the screen to filter audit entries by service type (SMB, Middleware, etc.).
The audit screen includes basic and advanced search options. Click Switch to Basic to change to the basic search function or click Switch to Advanced to show the advanced search operators.
You can enter any filters in the basic Search field to show events matching the entry.
To enter advanced search parameters, use the format displayed in the field, for example, Event = “CLOSE” to show close events. Use the Service dropdown to filter by service type (SMB, Middleware, etc.) before or after applying advanced search filters. Event types are listed in Auditing Event Types.
Advanced search uses a syntax similar to SQL/JQL and allows several custom variables for filtering. Parentheses define query priority. Clicking the advanced Search field prompts you with a dropdown of available event types, options, and operators to help you complete the search string.
For example, to search for connect or close events from the user smbuser, select SMB from the Service dropdown and enter Event in ("Connect", "Close") AND User = "smbuser" in the advanced search field. To exclude authentication events, enter Event != "Authentication".
The advanced search automatically checks syntax and shows done when the syntax is valid and warning for invalid syntax.
Click on a row to show details of that event in the Metadata and Event Data widgets.
Export provides a dropdown to export event log data in CSV, JSON, or YAML format. CSV files can be opened in spreadsheet programs (i.e., MS Excel, Google Sheets, etc.). JSON and YAML formats are useful for importing into data management applications or automation tools.
The assignment (Copy to Clipboard) icon shows two options, Copy Text and Copy Json. Copy Text copies the event to a text file. Copy Json copies the event to a JSON object.
Configure and enable SMB auditing for an SMB share at creation or when modifying an existing share.
SMB auditing is only supported for SMB2 (or newer) protocol-negotiated SMB sessions. SMB1 connections to shares with auditing enabled are rejected.
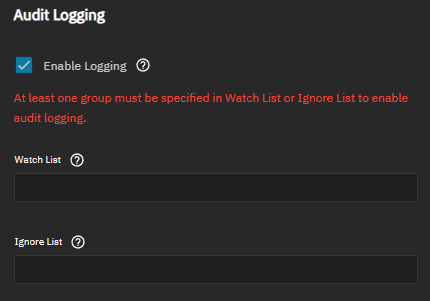
From the Add SMB Share or Edit SMB Share screen, click Advanced Options and scroll down to Audit Logging.
Selecting Enable turns auditing on for the share you are creating or editing.
At least one of Watch List or Ignore List must contain entries when enabling audit logging.
Auditing all SMB operations without restrictions creates large audit databases that grow rapidly and consume significant disk space. High-volume SMB environments can generate hundreds of thousands of audit entries per day, leading to increased disk I/O that affects overall system performance and database query delays when reviewing audit logs.
Configure filtering to audit only necessary operations.
Use Watch List to specify which groups should have their SMB operations audited. Use Ignore List to exclude specific groups from auditing.
- Click the Watch List field to display available groups on the system.
- Select a group to add it to the list.
- Repeat to add additional groups.
When Watch List contains entries, TrueNAS audits only SMB operations performed by members of the listed groups.
Configuring Ignore List:
- Click the Ignore List field to display available groups on the system.
- Select a group to exclude it from auditing.
- Repeat to exclude additional groups.
TrueNAS does not record SMB operations performed by members of groups in the Ignore List.
When using both lists: If a user is a member of groups in both Watch List and Ignore List, the Watch List takes precedence and TrueNAS audits that user’s operations.
SMB authentication events are logged globally for all users connecting to the SMB server, regardless of Watch List or Ignore List settings. Watch and ignore lists control subsequent operations (connect, file creates, reads, writes, etc.) but do not filter authentication events. Users in the Ignore List still have their initial authentication logged, but their file operations on the share are not audited.
Review your settings to verify that at least one list contains entries and the correct groups are selected.
Click Save.
After saving, you may need to restart the SMB service for audit logging to begin. Go to System Settings > Services, toggle the SMB service off then on, and verify the service is running before testing audit log generation.
To configure Audit storage and retention settings, click Audit Settings on the Audit screen or go to System > Advanced Settings, then click Configure on the Audit widget.
The Audit configuration screen sets the retention period, reservation size, quota size and percentage of used space in the audit dataset that triggers warning and critical alerts.
For example, to change the percent usage warning threshold for the storage allocated to the Audit database:
Navigate to System > Advanced screen.
Select the Configure button on the Audit widget.
In the Audit configuration popup, change the value in the Quota Fill Warning field to the desired percentage.
Select the Save button to effect the change.


