TrueNAS CORE Nightly Development Documentation
This content follows experimental early release software. Use the Product and Version selectors above to view content specific to a stable software release.
Reporting
4 minute read.
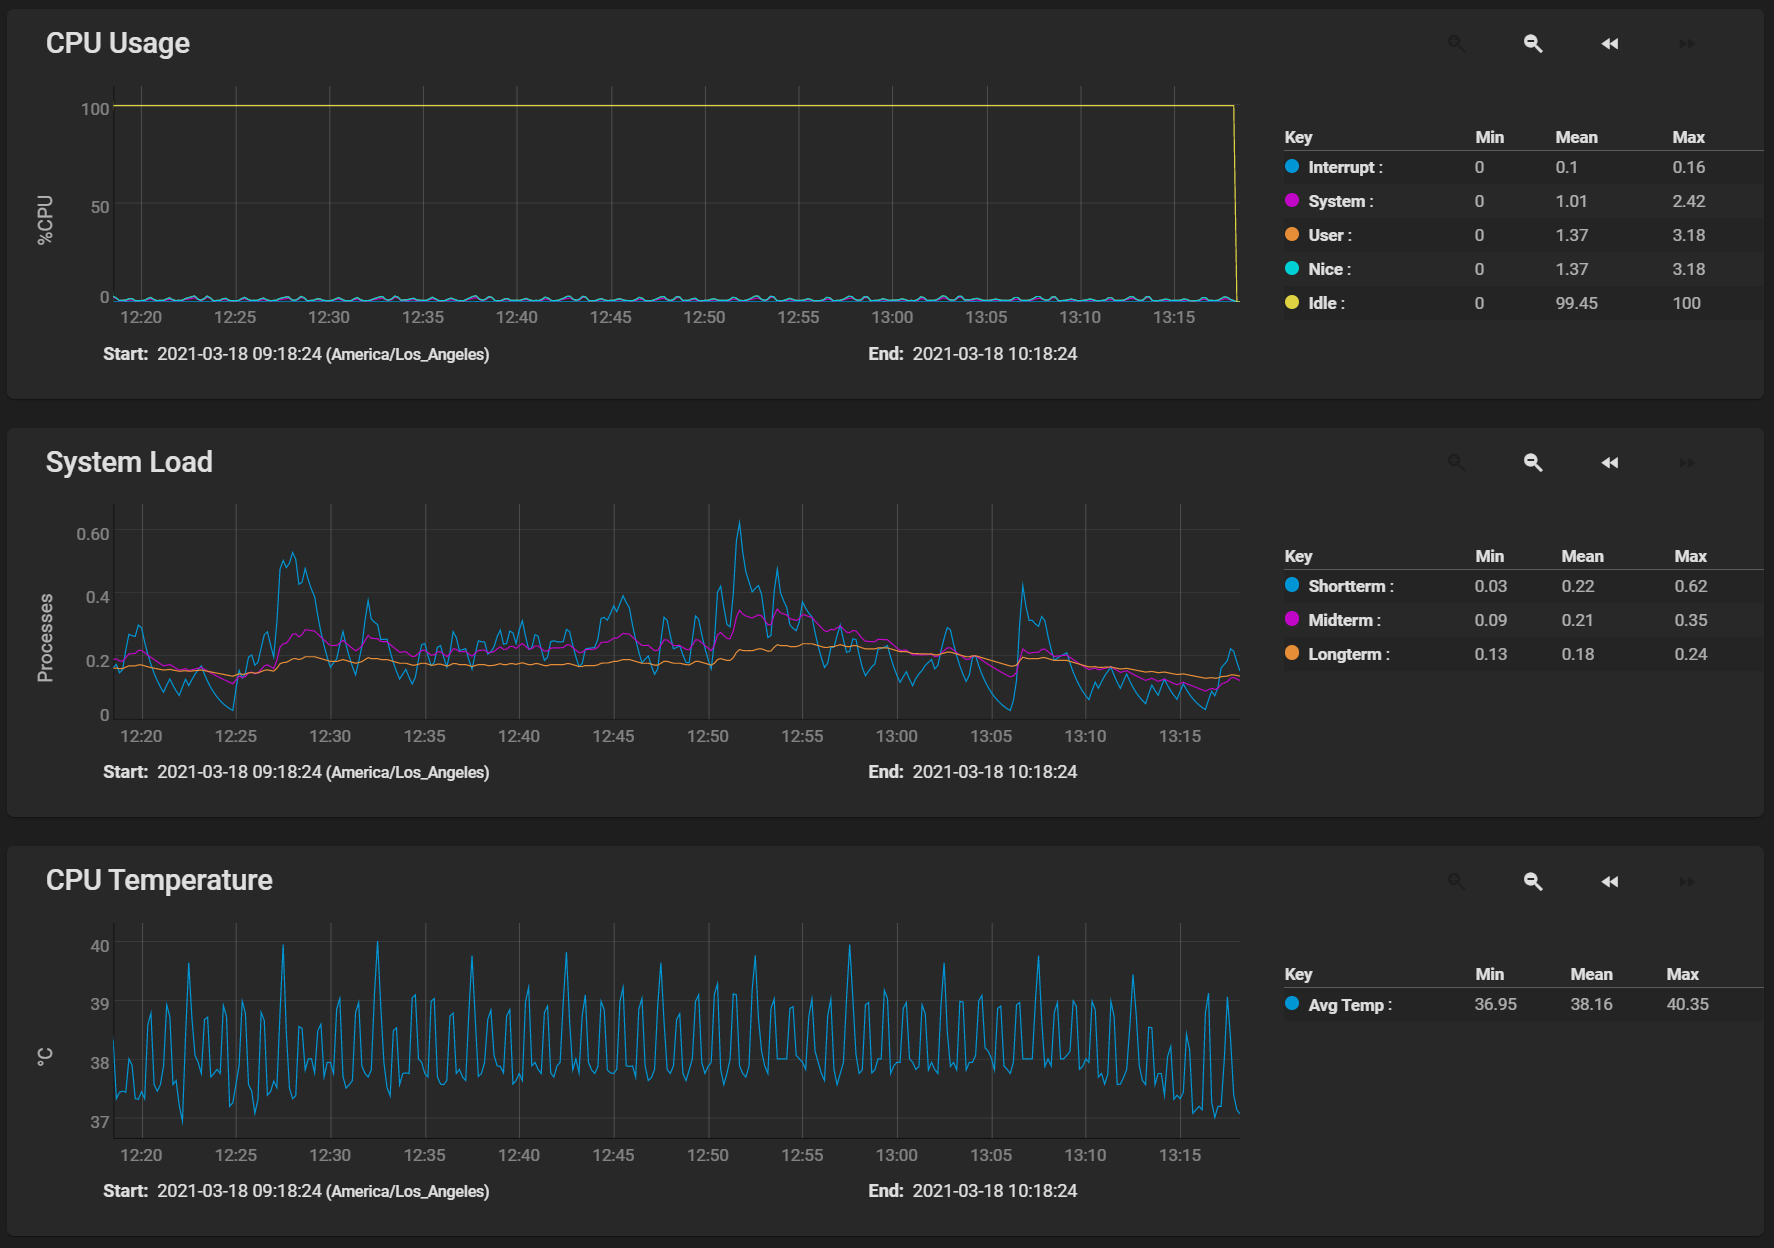
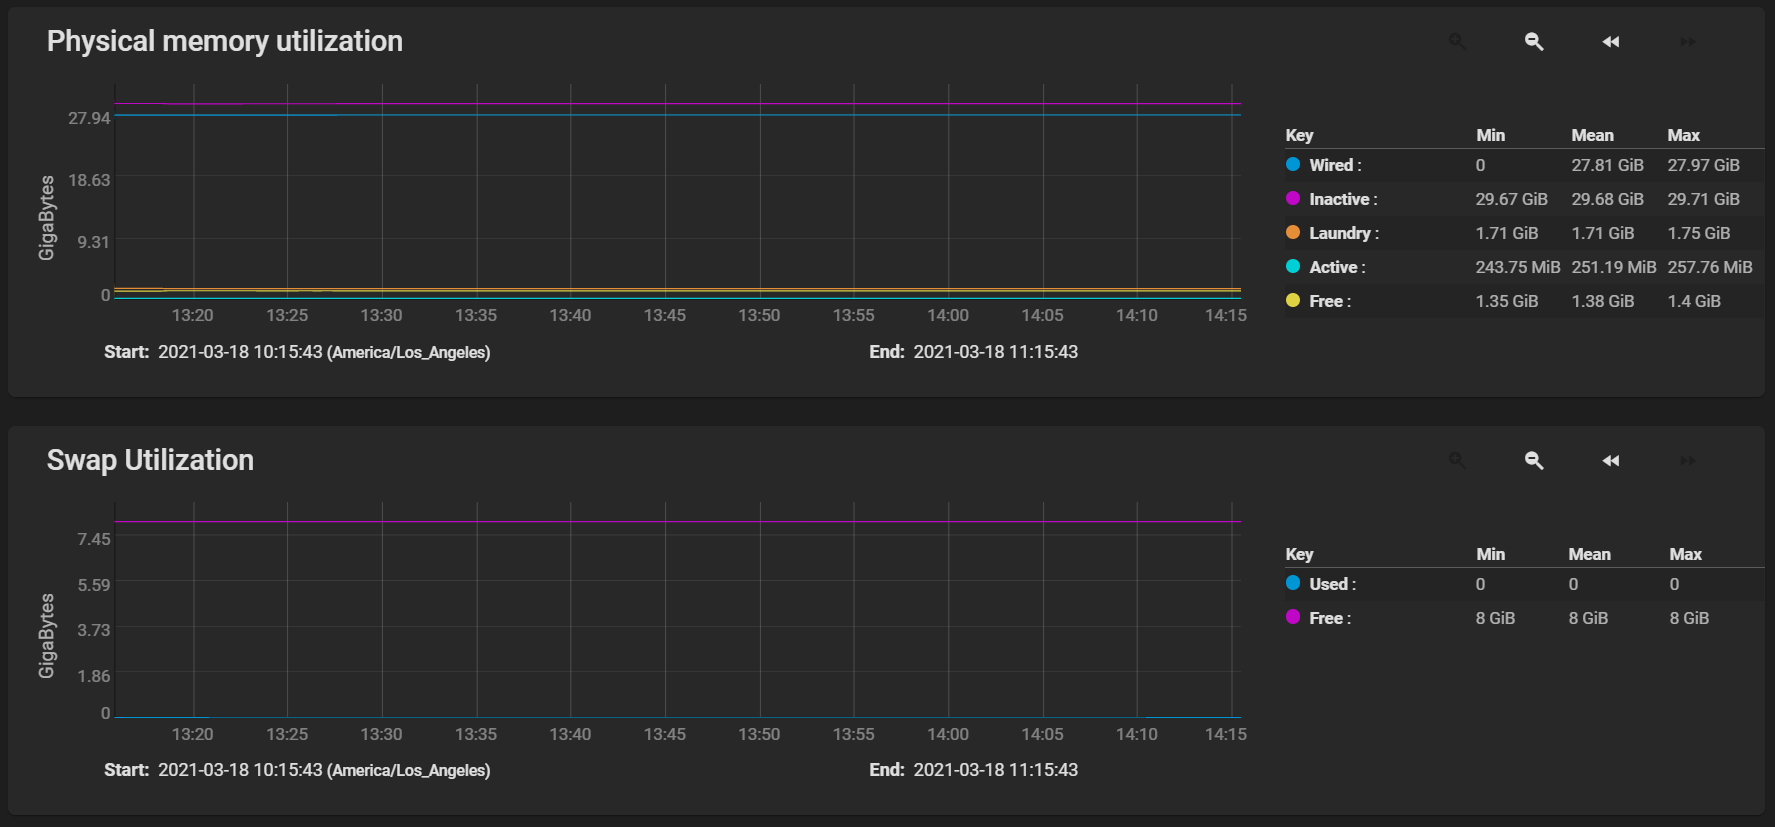
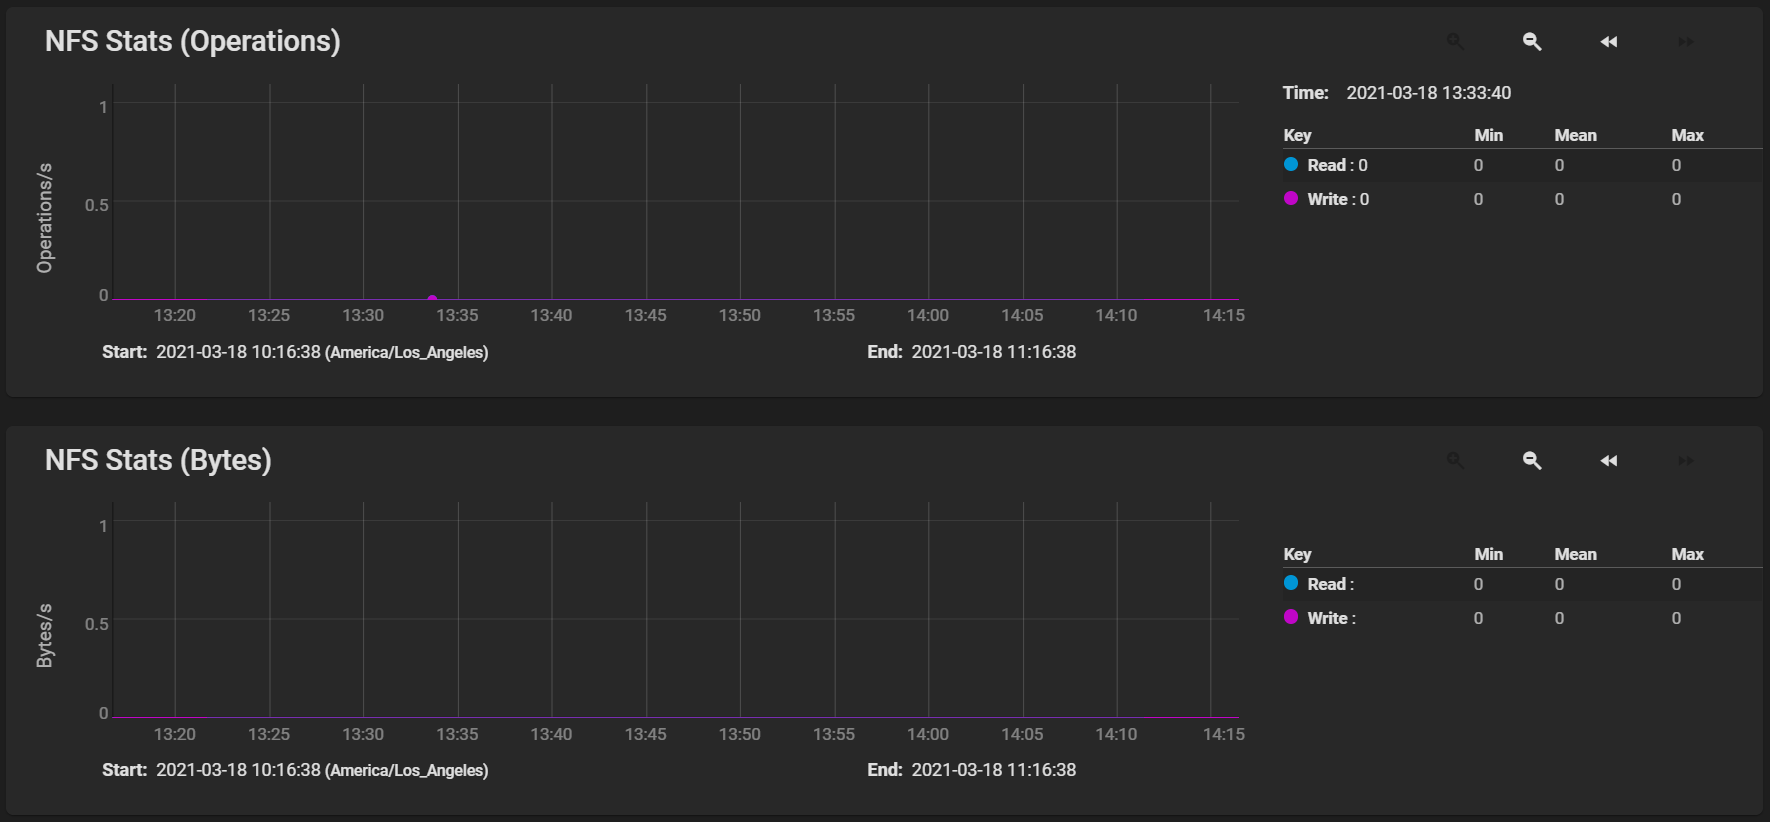
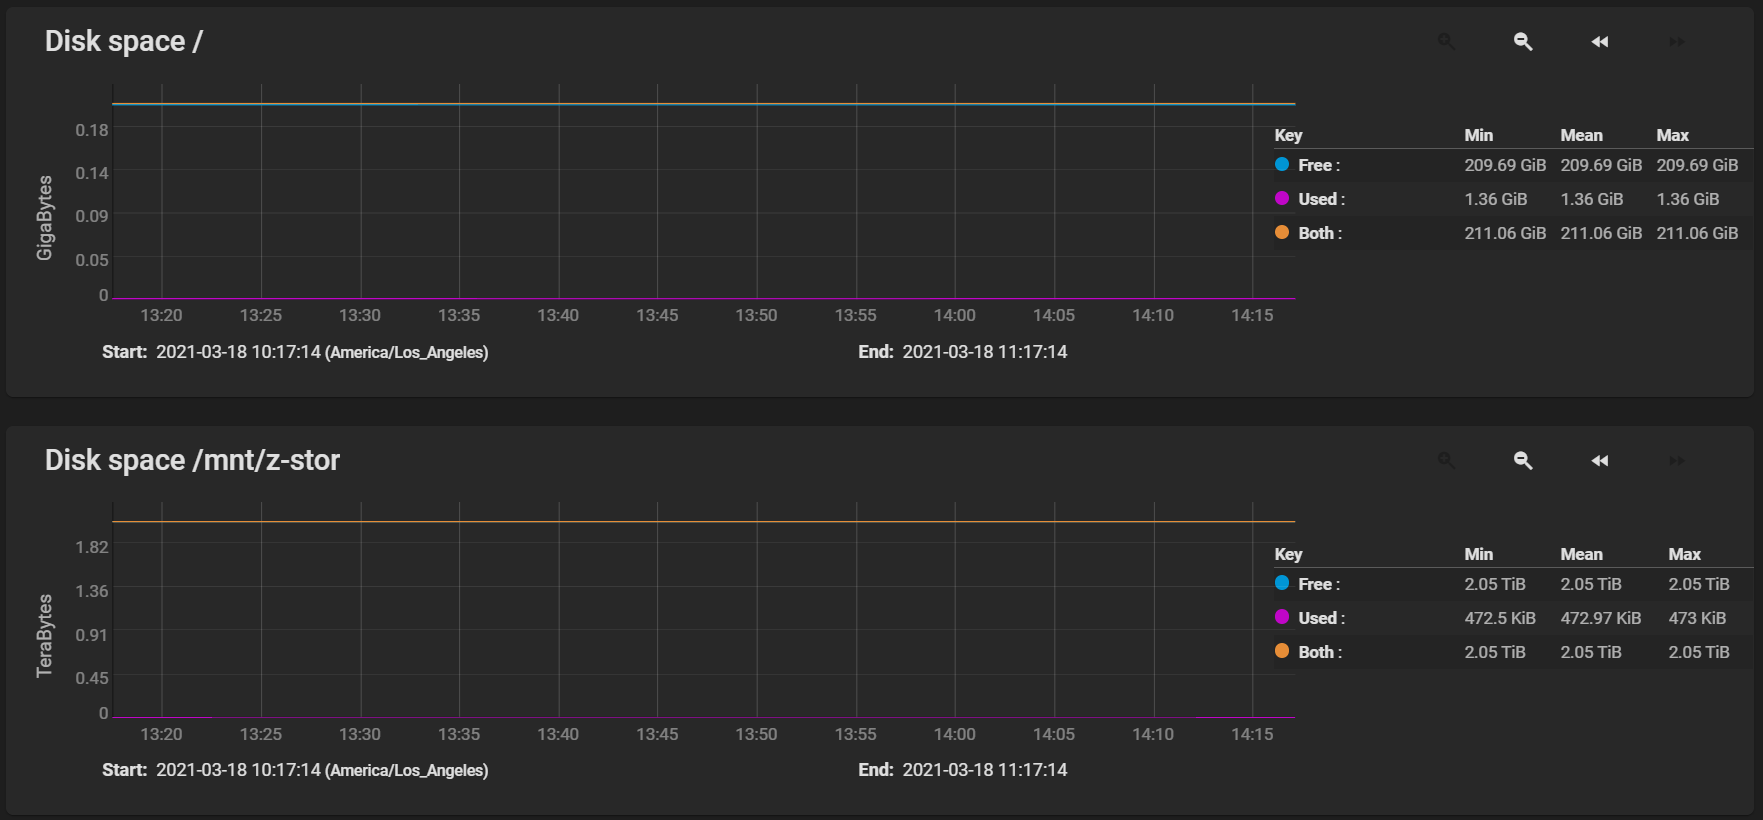
Last Modified 2023-12-18 16:30 ESTThe Reporting screen displays graphs of system information for CPU, disk, memory, network, NFS, partition, target, UPS, ZFS and system functions.
Reporting data is saved to permit viewing and monitoring usage trends over time. This data is preserved across system upgrades and restarts.
Data files are saved in
Because reporting data is frequently written it should not be stored on the boot pool or operating system device.

| Setting | Description |
|---|---|
| CPU | Displays the CPU Temperature, CPU Usage, and System Load graphs. |
| Disk | Displays graphs for each disk in the system. |
| Memory | Displays both the Physical memory utilization and Swap utilization graphs. |
| Network | Displays an Interface Traffic graph for each interface in the system. |
| NFS | Displays the NFS Stats (Operations) and NFS Stats (Byptes) graphs. |
| Partition | Displays graphs showing disk space allocations. |
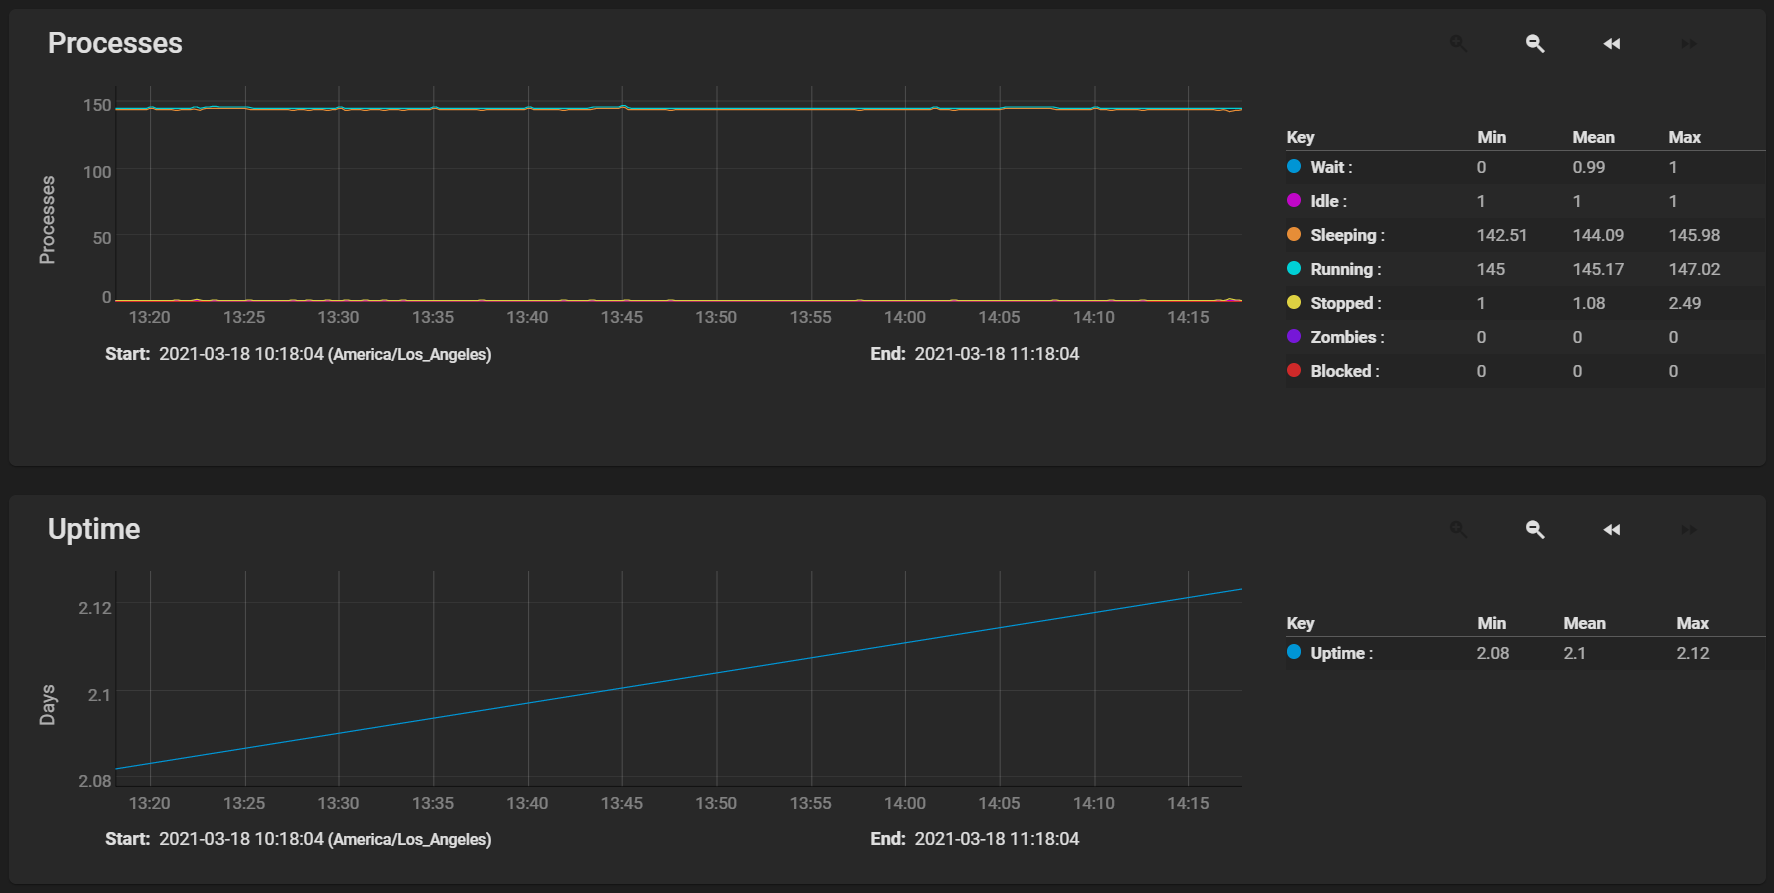
| System | Displays both the Processes and Uptime graphs. |
| Target | Displays graphs only for systems with iSCSI ports configured and shows the bandwidth statistics for iSCSI ports. |
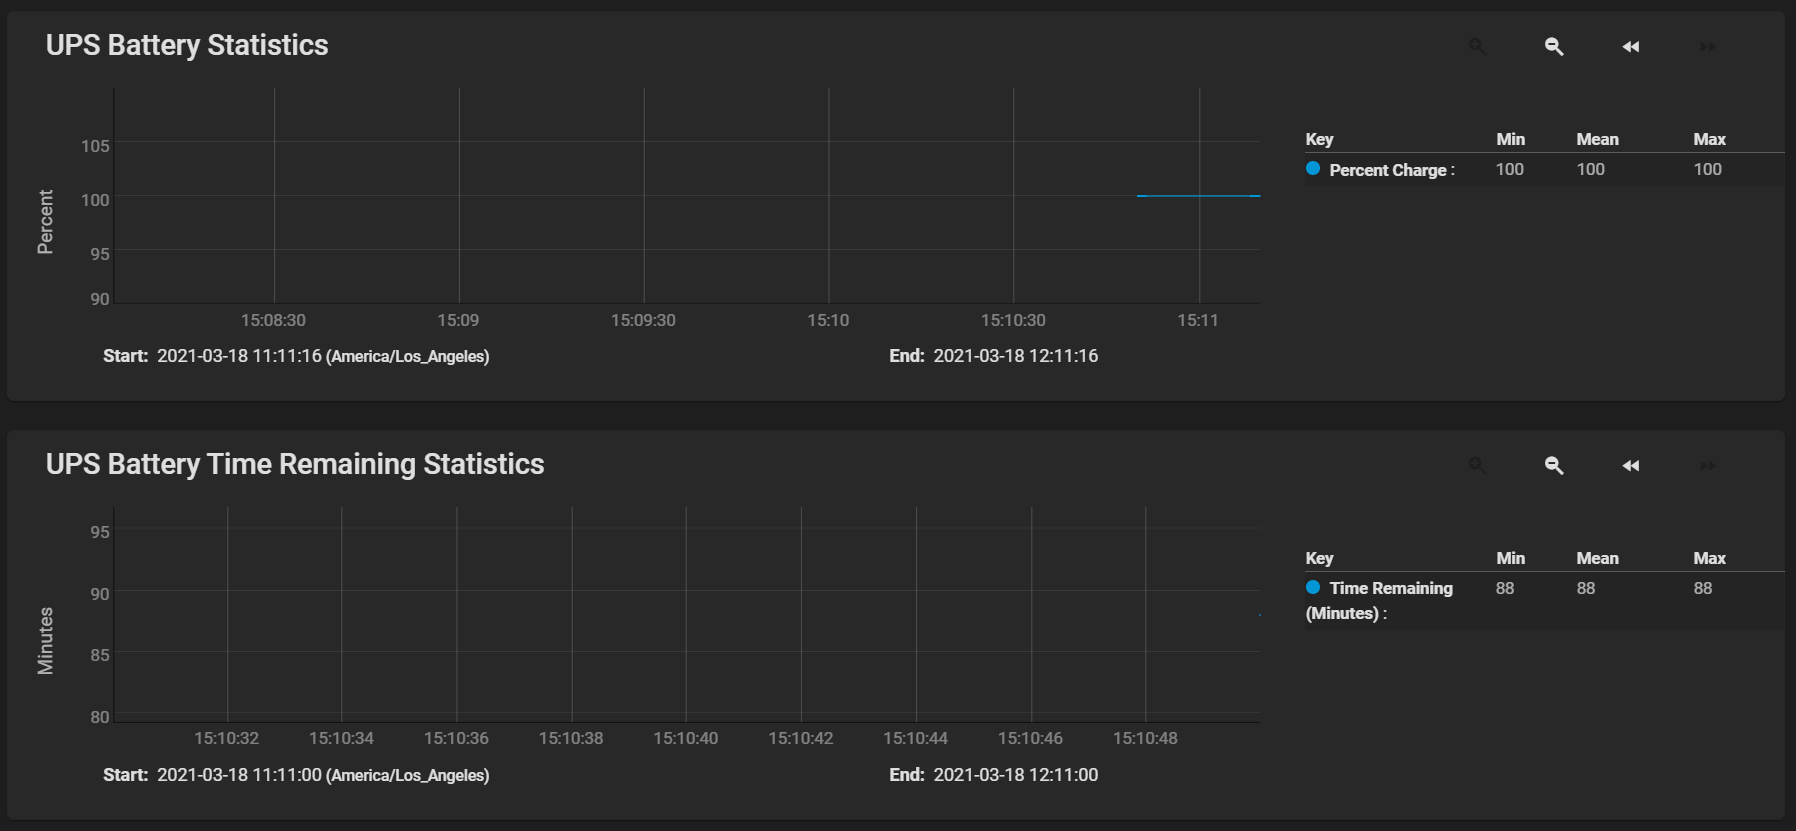
| UPS | Displays the graphs only if the system is configured for and uses a UPS. |
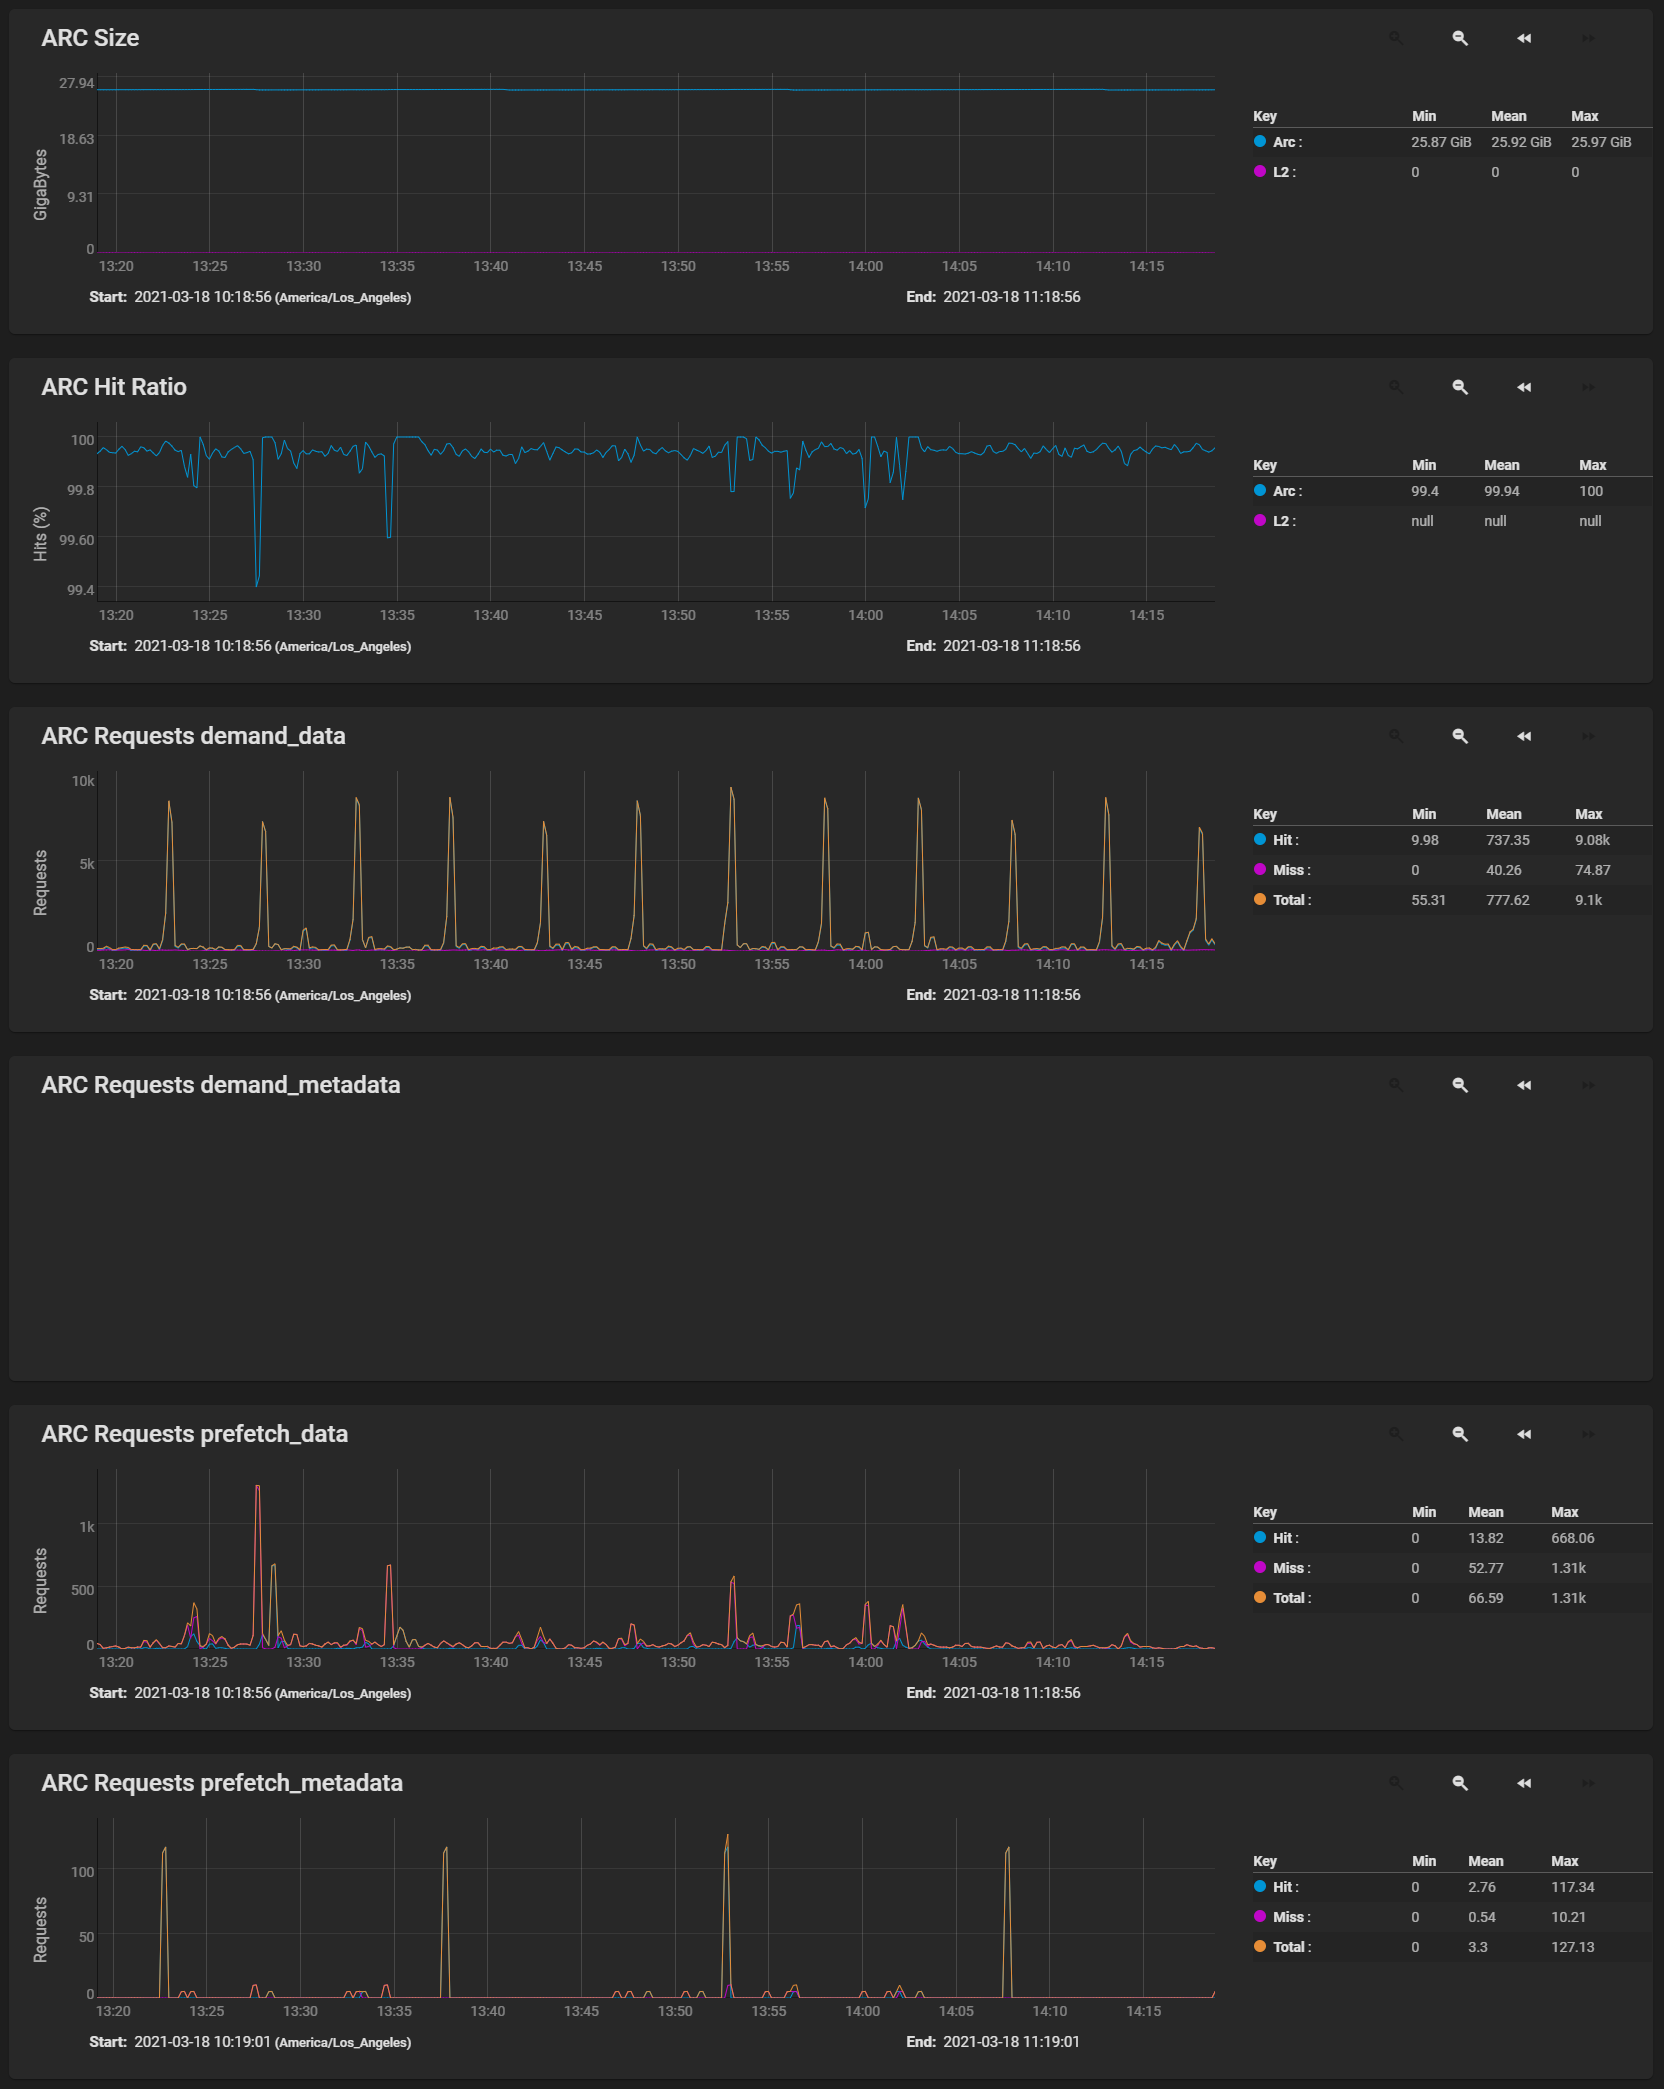
| ZFS | Displays the ARC Size, ARC Hit Ratio, ARC Requests demand_data, ARC Requests demand_metadata, ARC Requests prefetch_data, and ARC Requests prefetch_metadata graphs with the Arc and L2 gigabytes and hits (%), and the hits, misses and total number of requests. |
Click on and drag a certain range of the graph to expand the information displayed in that selected area in the Graph. Click on the icon to zoom in on the graph. Click on the icon to zoom out on the graph. Click the to move the graph forward. Click the to move the graph backward.


